-
Featured services
-
Services
View all services and productsLeverage our capabilities to accelerate your business transformation.
-
Services
Network Services
Popular Products
-
Private 5G
Our turnkey private 5G network enables custom-built solutions that are designed around unique use cases and strategies, and deployed, run and optimized through a full network-as-a-service model.
-
Managed Campus Networks
Our Managed Campus Networks services transform campus networks, corporate area networks and interconnected local area networks, and connect smart places and industries.
-
-
Services
Cloud
Popular Products
-
Cloud Architecture and Modernization
Discover how to achieve your business goals through cloud modernization practices, that deliver improved agility, reusability and scalability.
-
Cloud Optimization
Discover how to maximize operational excellence, business continuity and financial sustainability through our cloud-advanced optimization services.
-
-
Services
Consulting
-
-
Services
Data and Artificial intelligence
-
Services
Technology Solutions
Client stories
-
Services
Data Center Services
-
Services
CX and Design
-
Services
Application Services
-
Services
Sustainability Services
-
Services
Digital Workplace
-
Services
Business Process Services
-
-
-
Insights
Recent Insights
-
The Future of Networking in 2025 and Beyond
-
Using the cloud to cut costs needs the right approach
When organizations focus on transformation, a move to the cloud can deliver cost savings – but they often need expert advice to help them along their journey
-
Make zero trust security work for your organization
Make zero trust security work for your organization across hybrid work environments.
-
-
-
-
-
Discover how we accelerate your business transformation
-
About us
CLIENT STORIES
-
Liantis
Over time, Liantis – an established HR company in Belgium – had built up data islands and isolated solutions as part of their legacy system.
-
Randstad
We ensured that Randstad’s migration to Genesys Cloud CX had no impact on availability, ensuring an exceptional user experience for clients and talent.
-
-
- Careers


Topics in this article
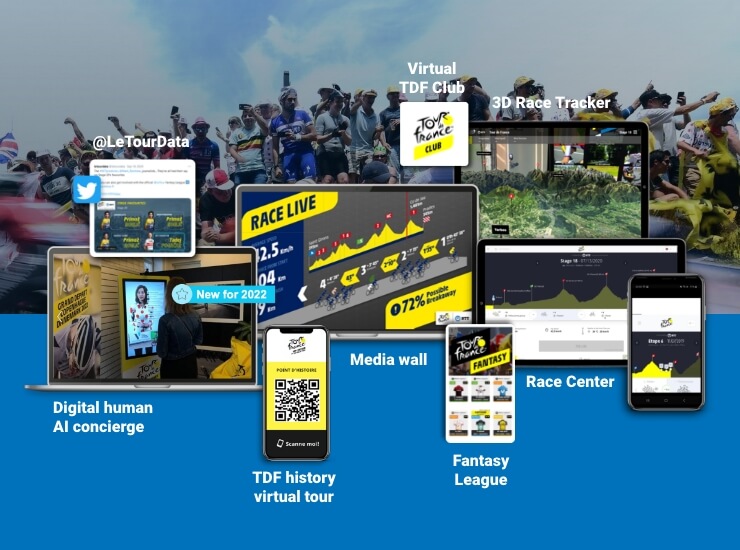
See what’s in store for Tour de France fans this year and don’t miss our infographic on the best ways to follow the race
The Tour de France is the world’s biggest annual sporting event, attracting millions of fans – over 150 million to the television broadcast, more than 30 million to the digital channels and millions of roadside fans. This year it will be held over 24 days and cover 3,300km, starting in Denmark for the Grand Depart and covering the most scenic parts of France, ending on the iconic Champs-Elysees in Paris. 2022 also includes the inaugural Tour de France Femmes avec Zwift race – 8 days that will showcase the very best of women’s pro-cycling.
This all adds up to a huge number of fans and a wide range of fan experiences to support. Since 2015 I’ve worked closely with the race organizers, Amaury Sports Organisation (A.S.O.), directly responsible for the digital and analytics platforms that deliver these experiences.
 The pain. The glory. The data drives the story. Learn how @GlobalNTT and @LeTour are providing the best-ever Tour de France fan experience and how to follow the race #TDF2022. Share
The heart of our fan experiences remains our real-time data platform. This collects data from every rider through the whole race, enriches it through machine learning models and advanced analytical algorithms and makes it available to a whole range of apps and services, from the speeds and gaps fans see on the television broadcast to the predictions and data-driven stories we publish on social media.
Topics in this article
Digital platforms
Our focus remains on revolutionizing the fan experience. The Race Center website is the key information hub for the race, providing live commentary, rich content, and unparalleled insights into the race. During each Tour we collect detailed usage data, building our understand of what’s effective in engaging our customers, the fans. This data helps A.S.O. and us shape an innovation roadmap. Our teams continue to refine the user experience and this year we’re adding significant exclusive content for Club TDF members (it’s free to sign up!).
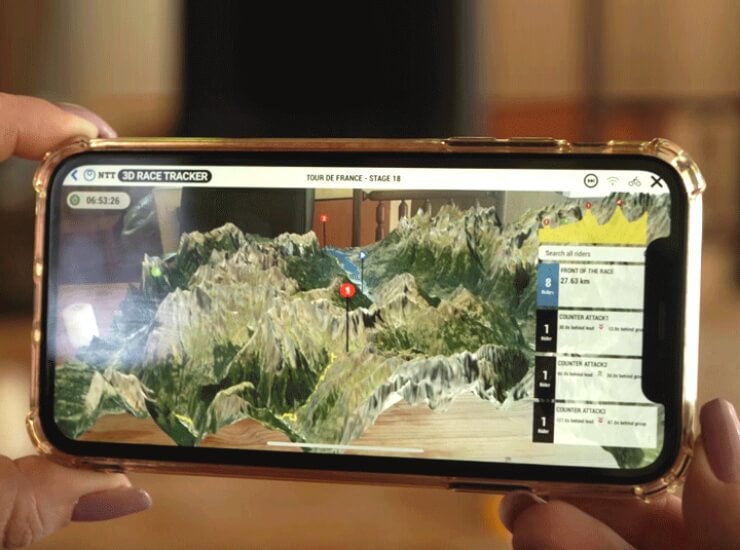
The Le Tour 3D Tracker app was launched last year and continues to be refined. This incredible augmented reality app shows the race progress in real time. It’s a digital twin of the race that includes detailed information on the riders, the weather, and the terrain through which the race is progressing. It’s available on both Apple and Google app stores and has proven a huge hit with the next generation of fans.
The world’s largest connected stadium
Our focus isn’t just the online fans. For the last two years we’ve been working with A.S.O. to digitize the event itself as part of a program to create the world’s largest connected stadium. The goal of this is to enhance the experience of the millions of roadside fans. One of the unique features of professional road cycling is how close fans can get to their heroes, but currently the experience is limited to the time it takes the riders to pass. With A.S.O., and the data from their years' of research, we built out the primary fan personas, helping us understand the motivations and priorities of these fans. This year we’ll be providing localized digital content for these roadside fans, giving them unique insights into some of the most iconic places on the route and encouraging further exploration of the route and local features.
This year the Grand Depart, for the first time, is in Denmark. To help fans navigate the chaos and excitement an event of this magnitude we’re rolling out a virtual assistant, a Digital Human called Marianne, who’ll be available to provide guidance and insights into the race and the locations of the Grand Depart. For fans at the race we’ll also be providing a number of big screen experiences through the NTT Media Wall. These allow us to tell the story of the race in data as each stage unfolds, highlighting the key events and providing a unique perspective for fans on site.
Data-driven stories
Our focus on enhancing the fan experience isn’t limited to websites and apps: through our real-time data platform we’re able to build exceptional insights into the riders, the teams and the race. Since 2015 we’ve had a small, specialist team that uses this data to uncover and tell stories that provide fans more detail and context into the race. This includes predictions on who is likely to perform well on each stage based on the specific route, their team and their competitors. We publish these stories on social media (follow us on Twitter @letourdata), on the Race Center website and on the television broadcast.
This year we’ve invested significantly in adapting our machine learning models and advanced analytics to the women’s peloton. Analyzing the data made it clear that the style of racing is significantly different: more aggressive and less controlled by the teams. One challenge was the much smaller number of comparable historical races to build and test our algorithms on. We essentially have a small data problem, which required a different approach to building machine learning models. Solving this has allowed us to create new stories to showcase different styles of racing and the key riders.
This year we’ll be combining our live-data insights with data from Strava, an athletic social media platform. This will allow us to compare the performance on the Tours with the performance of other pros and the best amateurs, and help fans understand just how exceptional the Tour riders are. As the @letourdata data scientist, I’m excited to see how these insights help fans understand just how amazing these races and the athletes are.